NASPI Voltage Stability Workshop
North American Synchrophasor Initiative (NASPI) held an Oscillation Detection and Voltage Stability Tools Technical Workshop [1] in Houston, Texas, on October 22, 2014. All participating contestants were given identical datasets for each test case in order to perform synchrophasor-based analysis. Data included a power system steady-state model, all operating assumptions, PMU measurement locations, and phasor measurement unit (PMU) data.
The goal of the workshop was to test several vendors’ applications against a known dataset to compare the various computational methods, algorithms, and visualization techniques used by each vendor tool. The participating vendors submitted videos describing their methodology, tools, and test case results prior to the workshop. The results of the analysis were not known to the participants ahead of time and were only announced on the day of the workshop.
NASPI representatives prepared two test cases for the voltage stability portion of the workshop.
V&R Energy won both cases.
NASPI Case 1 was a relatively simple case where synchrophasor-based voltage stability analysis was performed for N-0 conditions (i.e., contingency analysis was not performed). Case 2 was a more complex case where synchrophasor-based voltage stability analysis was performed for N-0 and N-1 contingency conditions. Detailed descriptions of the cases and workshop details are available in [2].
For NASPI VSA Test Case 1, participants were requested to demonstrate their tools by visually displaying any of the following information voltage profile trends: one-line diagrams of the system network, real and reactive power margins, voltage alarms or indicators, sensitivity analyses – PV or QV analysis, dV/dP, dV/dQ analytics and any other useful information to the system operator.
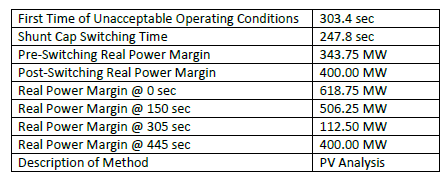
NASPI obtained the correct results from the sequence of power flow solutions created using time step simulation (TSS). The correct VSA results for VSA Test Case 1 that were announced by NASPI at the workshop are given in Table 1.
Table 1: Correct VSA Test Case 1 Results – announced by NASPI at the workshop
Five vendors participated in the Test Case 1 showcase. Results (submitted by the five participants to NASPI a week prior to the workshop) are shown in Table 2.
Table 2: VSA Test Case 1 Results – submitted by five vendor participants prior to the workshop
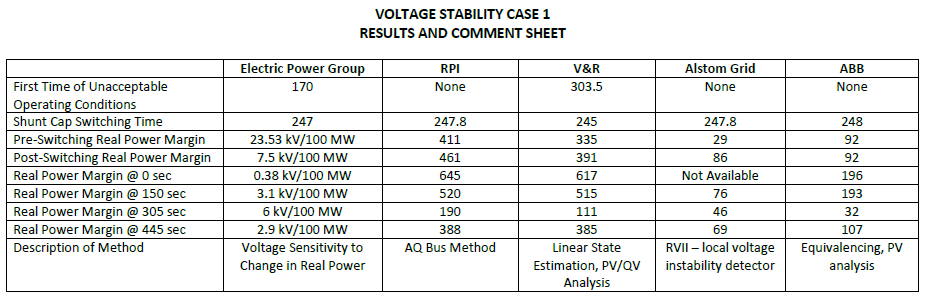
Only one participant, V&R Energy, accurately detected the time of unacceptable operating conditions using a linear state estimation (LSE)-based approach. This unacceptable state was not directly measured by the PMUs themselves but could be derived from the data provided in conjunction with the model. V&R Energy’s analysis process and results for Test Case 1 are shown in [2]. It was concluded in [3] that the LSE-based approach provided stability results that were very accurate when compared with the actual results obtained from the sequence of power flow models.
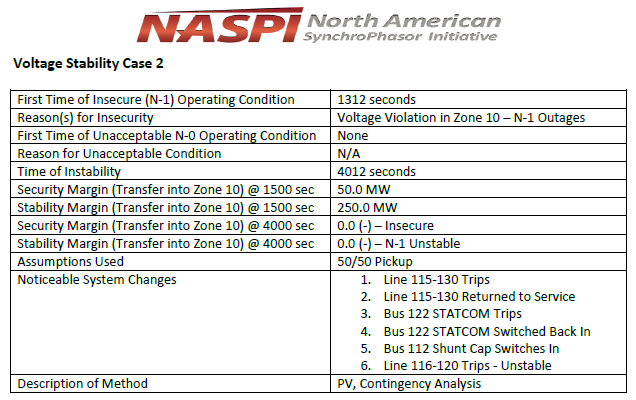
For NASPI VSA Test Case 2, participants were requested to identify and represent a region of stability and the respective stability margins at specific times. This included the identification of security and stability limits, unacceptable system conditions, and other useful information for visualization. The correct results obtained from the sequence of power flow solutions created by the TSS are given in Table 3.
Table 3: Correct VSA Test Case 2 Results – announced by NASPI at the workshop
Two vendors participated in the Case 2 showcase. Results submitted by the two vendors prior to the NASPI workshop are given in Table 4. V&R Energy’s analysis process and results for Test Case 2 are shown in [5]. The following conclusions were made regarding the results in [4]:
- The LSE-based method used by V&R Energy was able to accurately identify the times and reasons for insecurity and correctly identify the time of system collapse.
- The margins identified by the LSE-based approach were very close when compared with the actual results.
- The LSE-based approach not only identified line switching and shunt capacitor switching, but it also correctly identified the failure and return to service of the dynamic reactive resources in the load center. The STATCOM tripping offline has a significant impact on the reactive margin calculations.
Table 4: VSA Test Case 2 Results – submitted by two vendor participants prior to the workshop
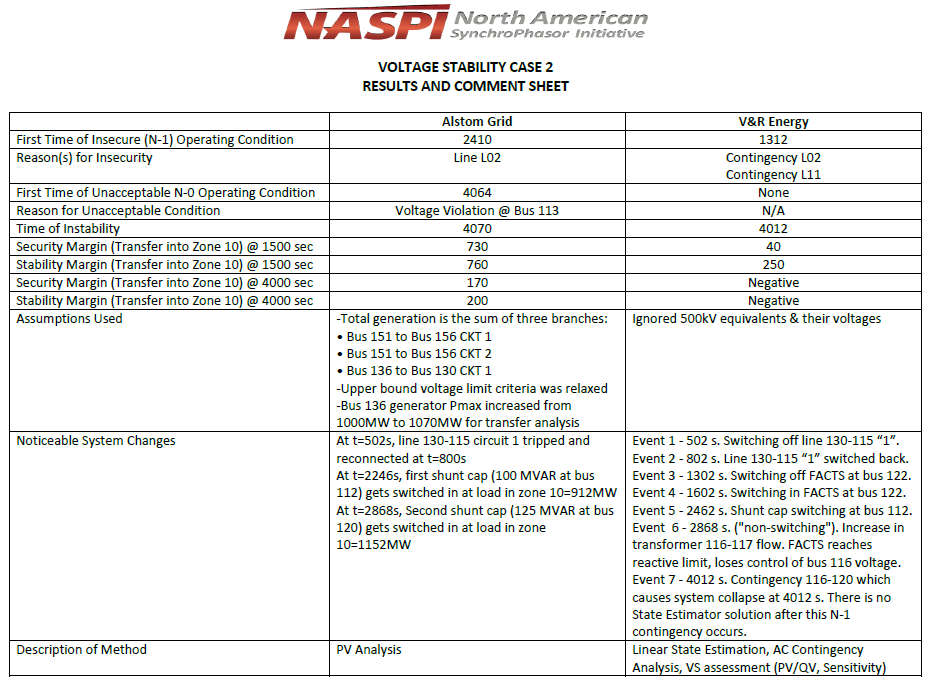
It was noted at the workshop that Alstom used PowerTech applications to obtain results for Test Case 2 (Table 4).
References
[1] NASPI Oscillation Detection and Voltage Stability Tools Technical Workshop, available at https://www.naspi.org/sites/default/files/reference_documents/27.pdf.
[2] V&R Energy, NASPI Test Case 1, available at https://www.youtube.com/watch?v=jvp2FBhcdfw.
[3] V&R Energy, NASPI Test Case 2, available at https://www.youtube.com/watch?v=js2SMURZUPA.
[4] Using Synchrophasor Data for Voltage Stability Assessment, NASPI CRSTT Paper, October 2015, available at https://www.naspi.org/sites/default/files/reference_documents/7.pdf.