Pioneering Use of Phasor Measurement Units (PMUs) for Voltage Stability Analysis
V&R Energy is one of the pioneers in developing synchrophasor-based software, with the first PMU-based application launched in 1996.
Region Of Stability Existence (ROSE) Evolution: ROSE 1996 to ROSE 2020
POM Suite/ROSE 1996 is shown in Figure 1. A boundary-based solution for the base case conditions (e.g., power transfer =0 MW) is shown on the plane of two phase angles in Figure 1. It determines the relationship between the region of stability existence and the maximum transfer capability for the specific interfaces.
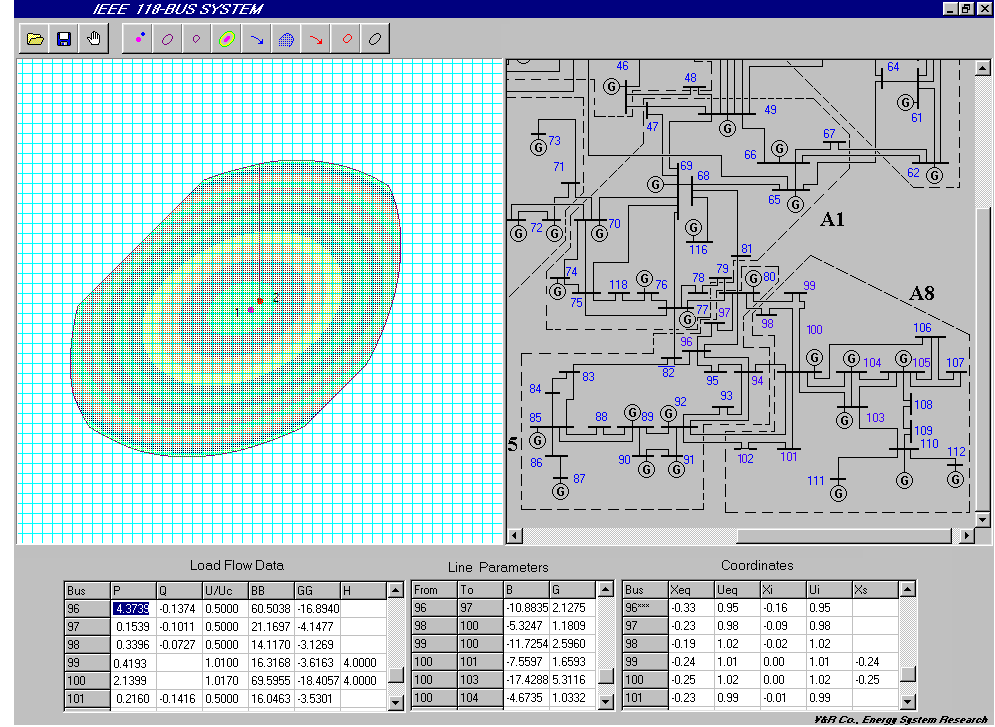
Figure 1. ROSE for Power Transfer = 0 MW
ROSE at the limit value of stressing is shown in Figure 2. The operating point lies on the region’s boundary.
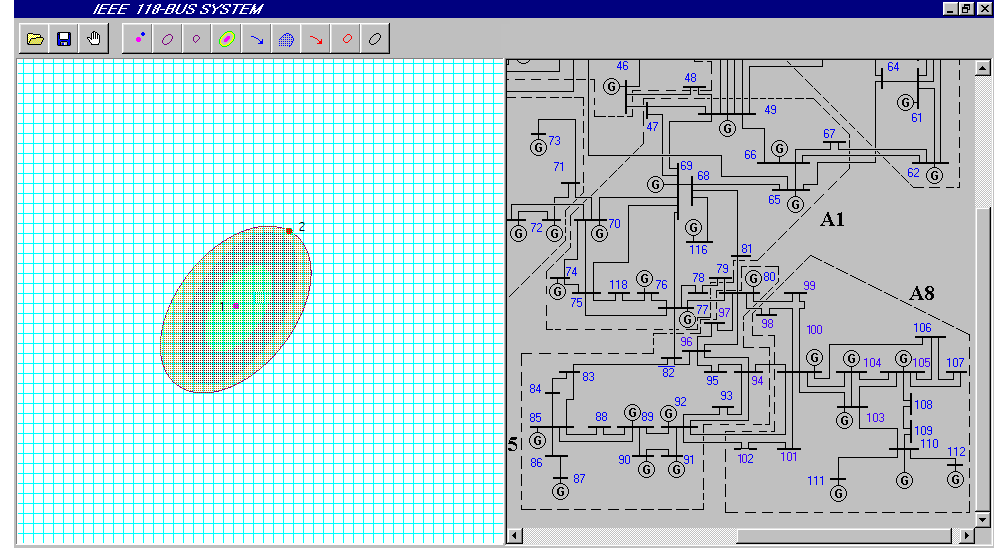
Figure 2. Identifying the Limit Value of Stressing in ROSE 1996
When the transfer limit is reached, remedial actions are invoked – see Figure 3.
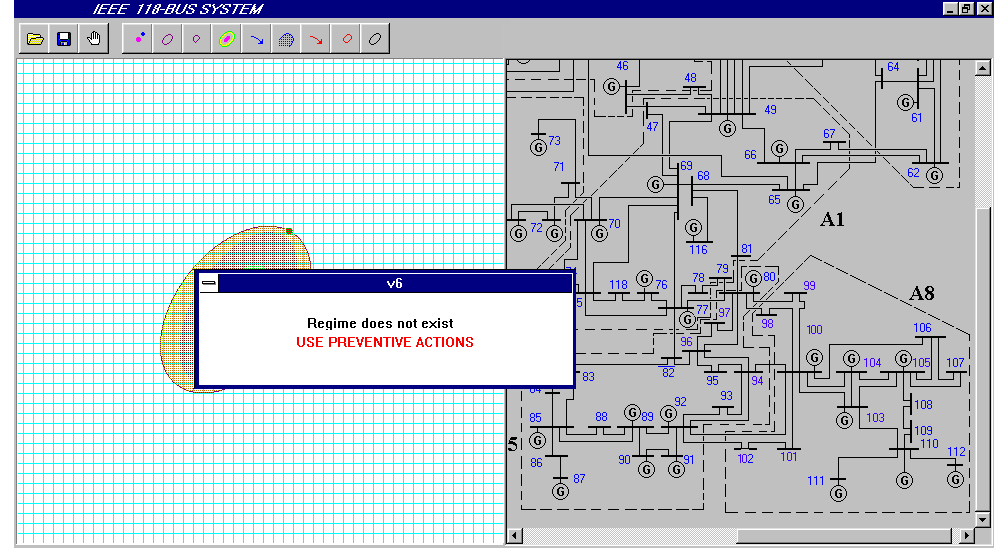
Figure 3. Invoking Remedial Actions in ROSE 1996
ROSE 2009 was tested and validated with ISO NE on ISO’s 12,000-bus State Estimator (SE) snapshots and PMU data under a CEATI project.
It was the first time a hybrid voltage stability approach was used when V&R Energy introduced combining SE and PMU data for voltage stability analysis.
The hybrid approach was implemented as follows:
- For buses where PMUs were installed, measurements supplied by the devices are used:
- The Concept of fixed voltage angle and reactive power consumption (“AQ Load bus”) was introduced in CEATI (Centre for Energy Advancement through Technological Innovation) report and IEEE paper published in 2010 [1].
- Results were also presented at the NASPI OITT Meeting on June 8 – 9, 2010, in Vancouver, Canada.
- For all other buses, power flow equations are solved, and values of bus voltage magnitudes and angles are determined.
ROSE used PMU, SCADA, and SE data (see Figure 4) for online calculation and visualization of the current operating point and its proximity to the stability boundary in order to continuously monitor the system.
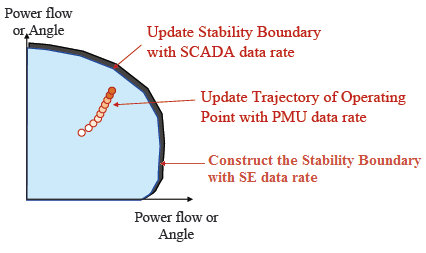
Figure 4. Hybrid ROSE Voltage Stability Approach
It identifies the limit values of:
- Phase angles
- Power flows (see Figure 5)
- Power injections, etc.
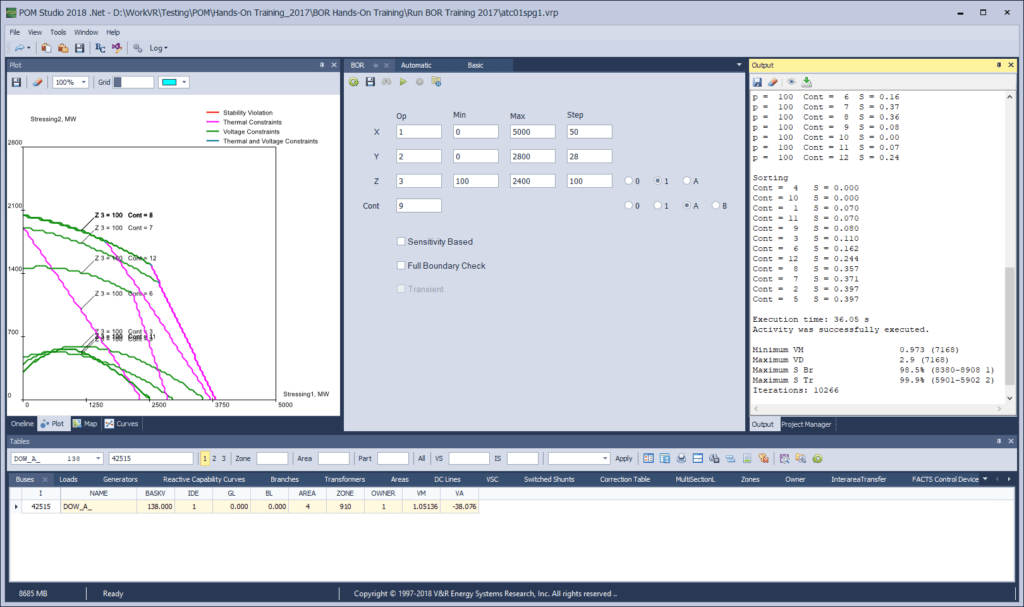
Figure 5. ROSE on the Plane of Power Transfer
Use of PMU data within this framework increases the situational awareness of operators (see Figure 6) as follows:
- Read a SE case at each X-minute interval, and compute and display a boundary of ROSE on the plane of two phase angles or other system parameters. The boundary is updated every several seconds (i.e., sampling intervals of SCADA).
- Show the current operating point within the region at the PMU sampling rate.
- Every several seconds, ROSE determines system conditions – i.e., the closeness of the current operating point to the boundary of stability. The operator is alerted if the operating point and the boundary are moving toward each other.
The ROSE 2009 framework is given in Figure 6.
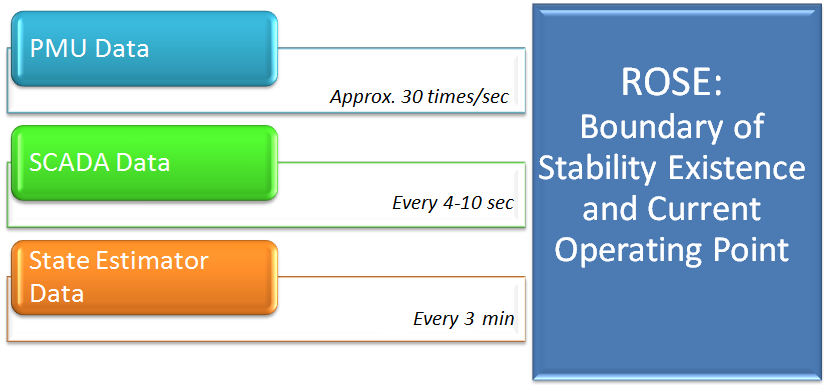
Figure 6. The ROSE Framework
ROSE identifies optimal control actions to relieve violations and increase the size of the operating region through the OPM (optimal mitigation measures) module.
Optimal mitigation measures include MW redispatch, MVAR redispatch, ULTC settings, phase shifter settings, switching CAP banks, line switching, and load curtailment.
If the operating point and the boundary are moving towards each other, ROSE automatically identifies (e.g., recommends to the operator) minimal optimal preventive actions before the new SE case arrives and before a system collapse.
The 2-D ROSE boundary may be constructed by changing the values of two phase angles while other parameters were fixed:
- For different levels of stressing
- Under contingency conditions
- While simultaneously monitoring voltage, thermal and steady-state stability limits
- Remedial actions were invoked
- Displayed on the planes of phase angles and real powers
Figure 7 shows the effect of contingencies on the ROSE boundary and the movement of the operating point. The operating point moves in the direction in which the boundary shrinks after the contingency has been applied. Post-contingency, the operating point lies on the ROSE boundary. This is a limiting contingency with the smallest margin.
The ROSE boundary is shown on the plane of two phase angles:
- The operating point moves in the direction in which the boundary shrinks
- The point lies on the boundary
- This is a limiting contingency as it has the smallest margin
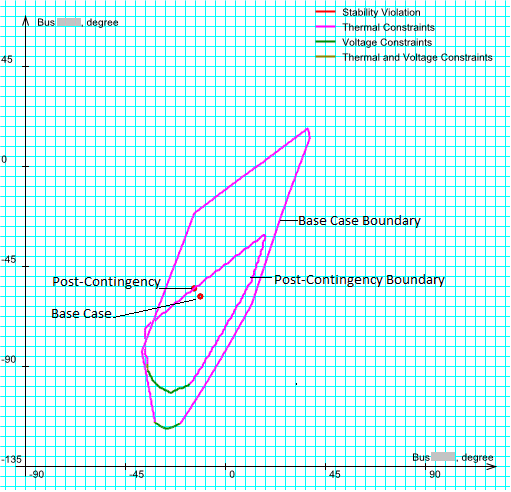
Figure 7. Identifying Limiting Contingency in ROSE 2009
Remedial actions were also computed in order to increase the size of the ROSE. Figure 8 shows the effect of remedial actions on increasing the size of the ROSE.
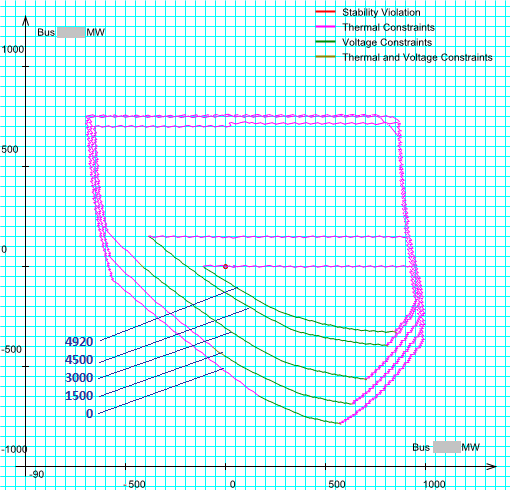
Figure 8. The ROSE Boundaries on the Plane of Real Powers after the Use of Remedial Actions for the Base Case and Stressed Cases
The project demonstrated the effectiveness of the proposed approach, ROSE, for the calculation and visualization of the power system stability margin based on the PMU measurements.
ROSE 2017 is shown in Figure 9. The system may be securely operated only below the boundary:
- The boundary is reached when one of the monitored constraints is violated.
- The smaller the secure operating region is, the more severe the system conditions.
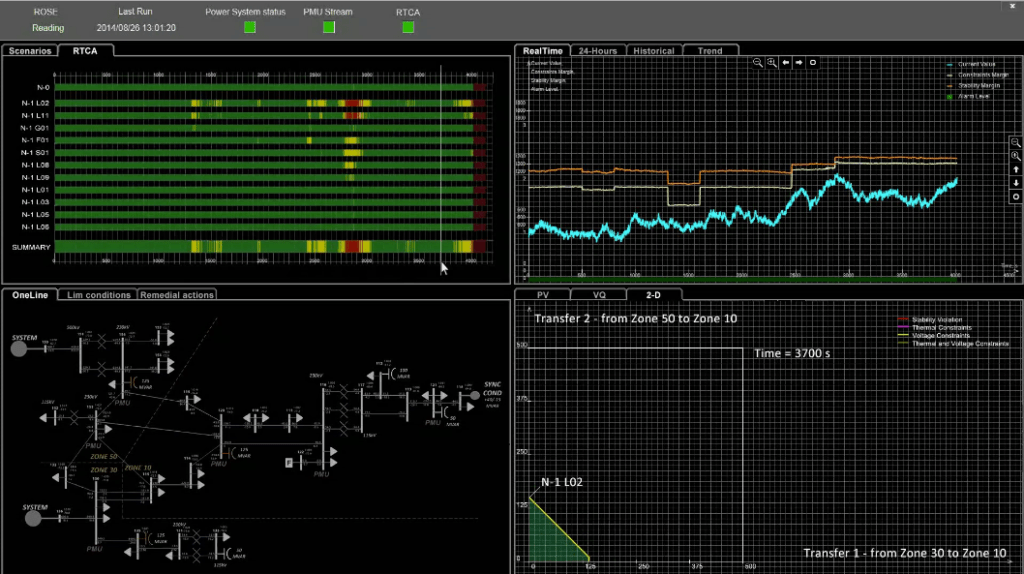
Figure 9. RTCA, VSA, and a Boundary-Based Solution in ROSE 2017
In 2018, PMU ROSE and D-PMU ROSE were deployed. Both applications are intended for PMU-based analysis, including linear state estimation.
PMU ROSE focuses on real-time transmission system analysis and monitoring, while D-PMU ROSE offers real-time distribution system analysis and monitoring.