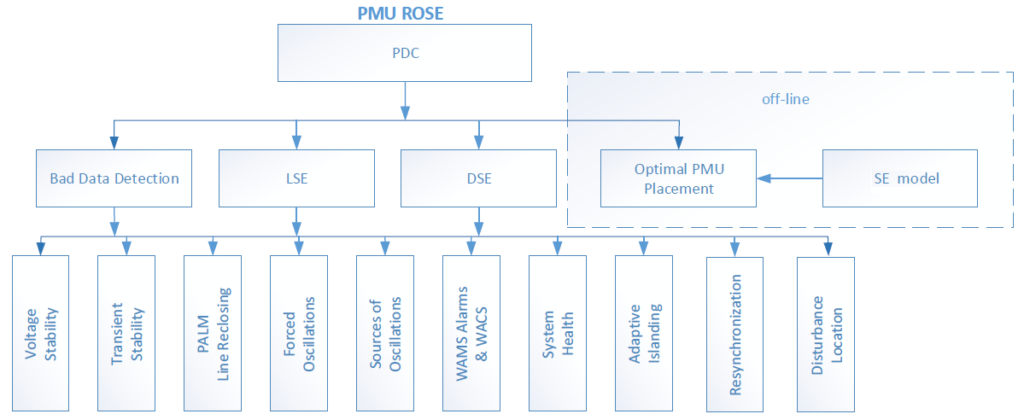
PMU-Based Real-Time Application for Transmission System Monitoring and Analysis PMU ROSE
Phasor measurement units (PMUs) provide the capability for improved real-time monitoring and control, and enhanced power system analysis in the planning environment. PMU-ROSE is a PMU-based platform to obtain situational awareness in order to improve resilience of the grid and enhance its reliability.
PMU ROSE is real-time, PMU-based software for transmission system monitoring and analysis.
PMU ROSELinear State Estimator (LSE)
Components of PMU ROSE LSE
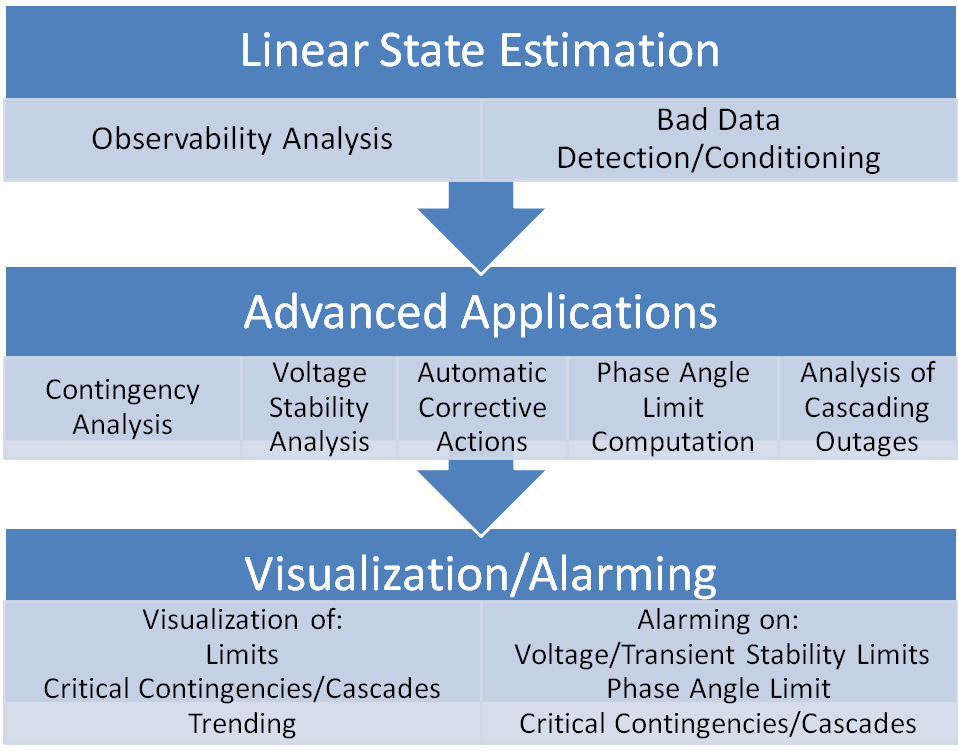
Components of PMU ROSE LSE include:
- Linear state estimator (LSE)based on weighted least squares (WLS) method;
- Bad data detection and correction;
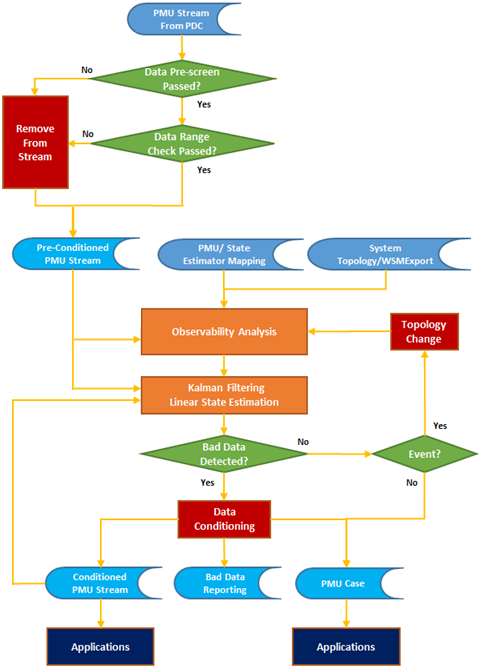
- Real-time observability analysis to identify observable parts of the system, which include:
- Buses and branches where PMUs are located (e.g., PMU buses/branches);
- Buses where voltages may be computed based on PMU data;
- Branches where current may be computed based on PMU data;
- Identification of switching events;
- Creation of PMU-based state estimator case (e.g., PMU case) for the use by advanced applications;
- Advanced visualization of the system state;
- Alarming/reporting/archiving;
- Running advanced applications (AC contingency analysis, voltage stability analysis, etc.) using PMU cases;
Observability analysis and PMU placement
Observability analysis and optimal PMU placement are important components of PMU ROSE. Since voltages are state variables for the steady-state model of a power system network, PMU ROSEconsiders a power system network to be observable if voltage vector at each node can be calculated based on the PMU measurements. The data sets used for observability analysis are:
- PMU data;
- State estimator (SE) data;
- PMU/SE mapping.
The result of observability analysis changes when topology changes or PMU signal is lost.
Observability analysis in PMU ROSE not only identifies observable portions of the system, but also determines locations of additional installations of PMUs. PMU placement problem refers to the minimum number of PMUs to be placed in the network while maintaining observability of the entire electric power system network. Formulating optimal PMU placement as a binary linear programming problem is used in PMU ROSE. Optimal PMU placement in PMU ROSE can consider current PMU installations as well as excluded (e.g., prohibited) locations, and identifies locations of new PMU installations to fully observe the system. The approach incorporated into the PMU ROSE requires a smaller number of PMUs to achieve system observability as compared to published algorithms.
Bad data detection and conditioning
Bad data detection and conditioning is a part of this framework. Implemented in the PMU-ROSE software, it is a multistep process that includes:
Step 1. Several prescreening techniques and data range checks.
Step 2. Combination of filtering and smoothing techniques.
Step 3. Linear state estimation
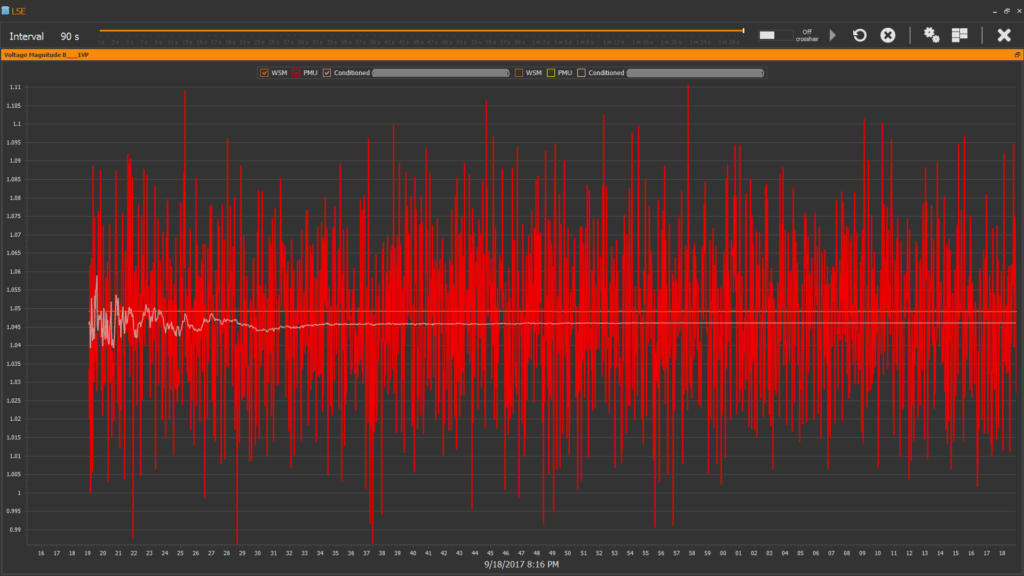
Filtering, used in PMU-ROSE, offers an accurate prediction (orange curve) as compared the measured values (blue curve).
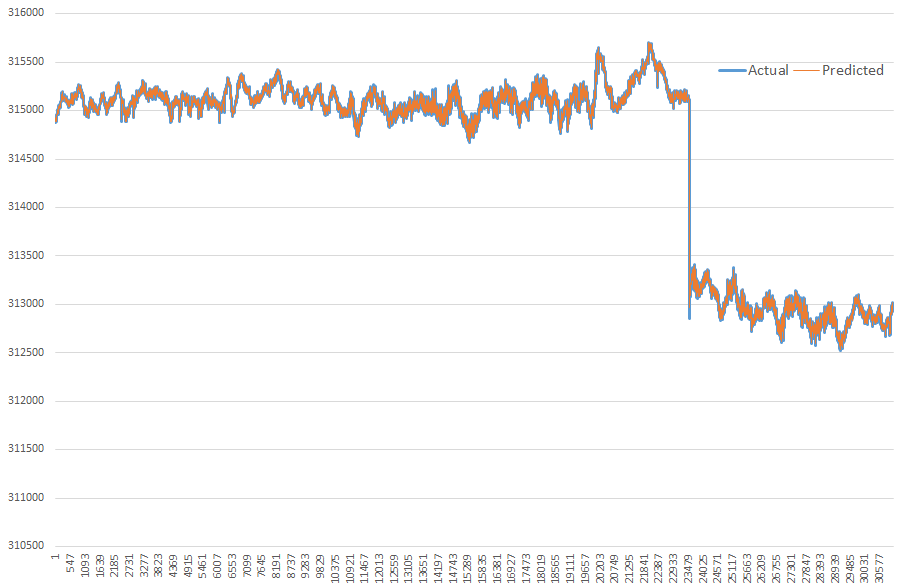
It can be also used to effectively address PMU data dropouts.
One of the PMU ROSE implementations is shown in the figure below.
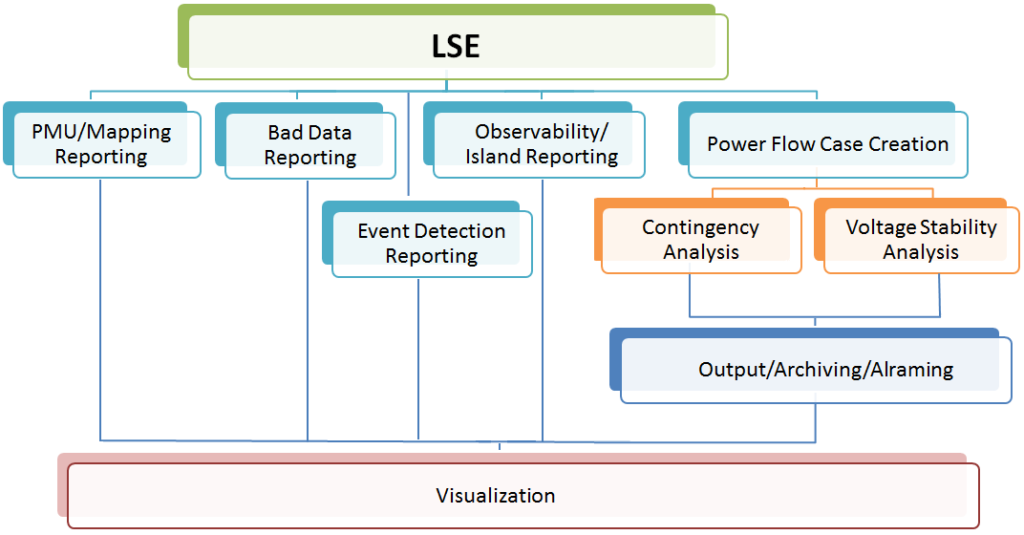
PMU ROSE output
The output of this process includes:
- Conditioned PMU data;
- Bad data reporting and statistics;
- Event alarms and logs;
- Bad data detection alarms and logs;
- A list of observable islands and their details; and
- PMU-based state estimator case (e.g., PMU Case);
- Archives.
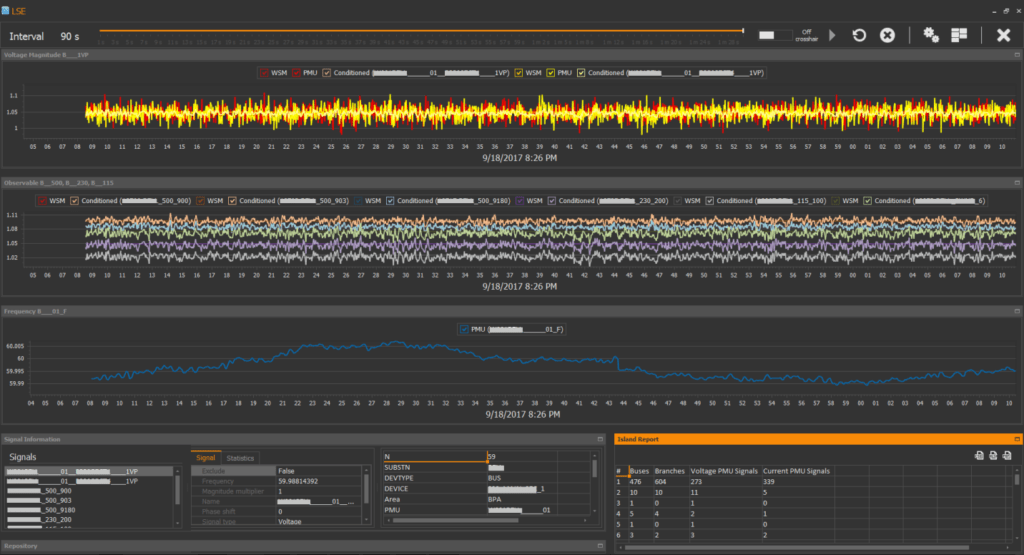
PMU ROSE provides the mechanism for selecting, viewing and analyzing the input data and LSE result. It also allows to compare the conventional state estimation results and LSE results.
Machine learning in PMU ROSE
PMU ROSE also includes end-to-end machine learning during the LSE calculations. During learning PMU-ROSE wants to learn the best parameters to maximize the likelihood of the input values. At each step, PMU ROSE calculates the likelihood of the new input values and the derivatives of this likelihood by all parameters included in learning, and makes a small gradient step towards likelihood maximization. After several hundred steps, the parameters are adopted to the data. Online learning is performed continuously.
When machine learning is disabled, there’s a difference between the results of LSE (pink plot) and conventional state estimator solution (orange plot).
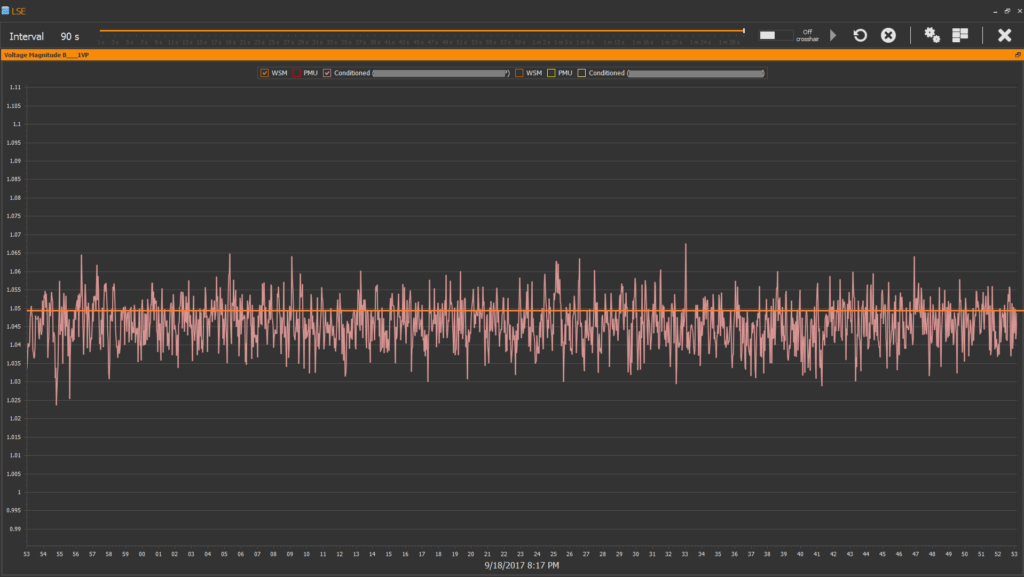
When machine learning is enabled results of LSE (pink plot) and state estimator solution (orange plot) are closer than when machine learning is disabled. The red plot is raw PMU data.