Real-Time Distribution System Monitoring and Analysis PMU ROSE (D-PMU ROSE)
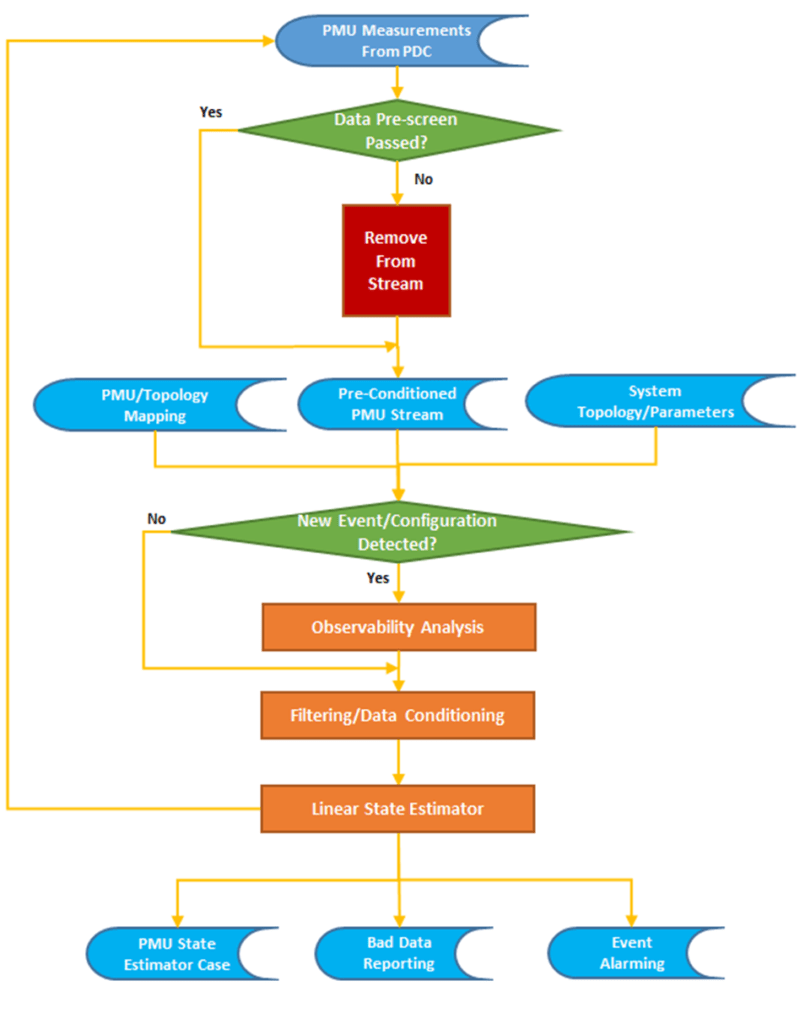
Distribution linear state estimation (DLSE) is the basis of the Distribution PMU Region of Stability Existence (D-PMU ROSE), a synchrophasor-based software platform that provides real-time situational awareness and monitoring of the distribution system.
Functionalities of D-PMU ROSE include:
- Three-phase D-LSE based on weighted least squares (WLS) method;
- Bad PMU data detection and correction.
- Observability analysis to identify portions of the distribution network observable with PMU measurements.
- PMU placement to achieve full distribution grid observability;
- Identifying switching events‑ for example, changes in microgrid configuration (full island, sub-island, grid-connected, etc.).
- Archiving and alarming.
- Improved situational awareness through real-time visualization of PMU data and events.
All these functions are available at the PMU streaming rate, typically 30 or 60 times per second.
Results of the PMU-based platform include:
- Estimated three-phase voltages, currents, and real and reactive power at locations where PMUs are installed, and at locations where PMUs are not installed but are observable using PMU measurements.
- Identification of bad PMU data.
- Switching event detection and archives.
- Violation alarms and archives.
- Real-time visualization of microgrid state, including PMU data, estimated values, switching events and violations.
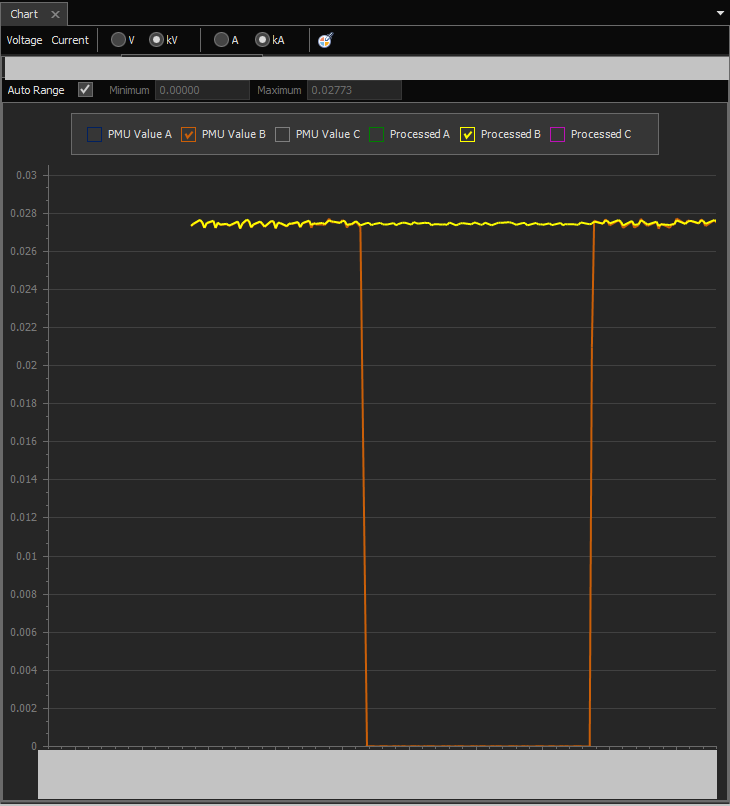
D-PMU ROSE conditions PMU data dropouts. Raw PMU data is shown in orange and conditioned PMU data after filtering, and D-LSE is shown in yellow in the figure below.
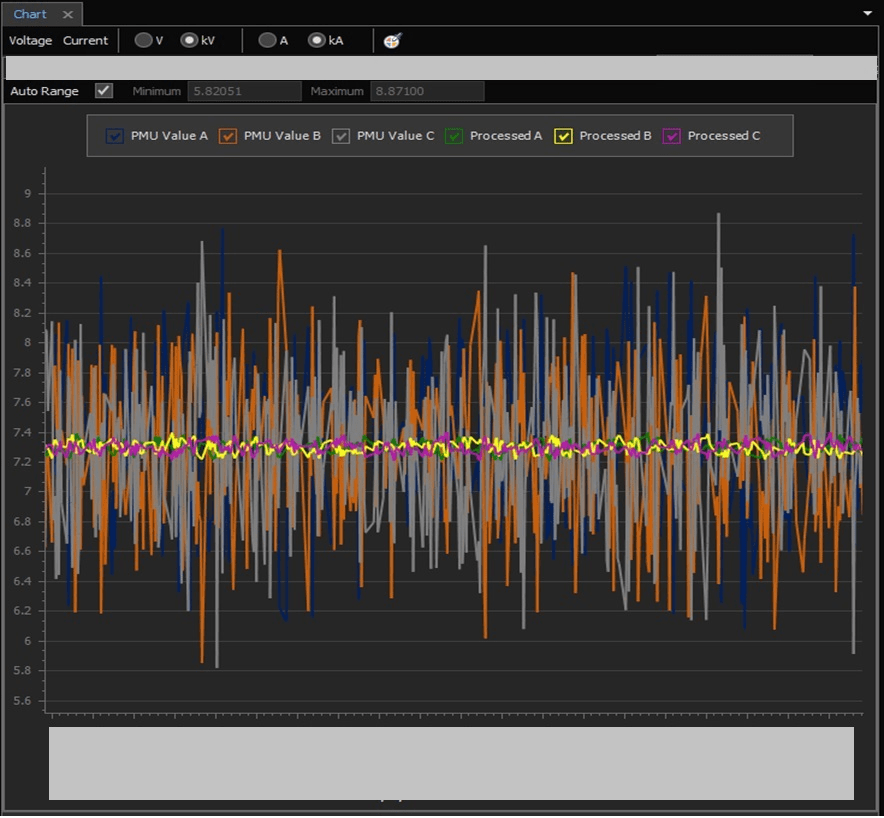
D-PMU ROSE also includes smoothing and filtering of PMU data. Raw PMU data with noise (Phase A – blue, Phase B – orange, Phase C – gray) and conditioned data after filtering and smoothing (Phase A – green, Phase B – yellow, Phase C – pink) are illustrated in the figure below.
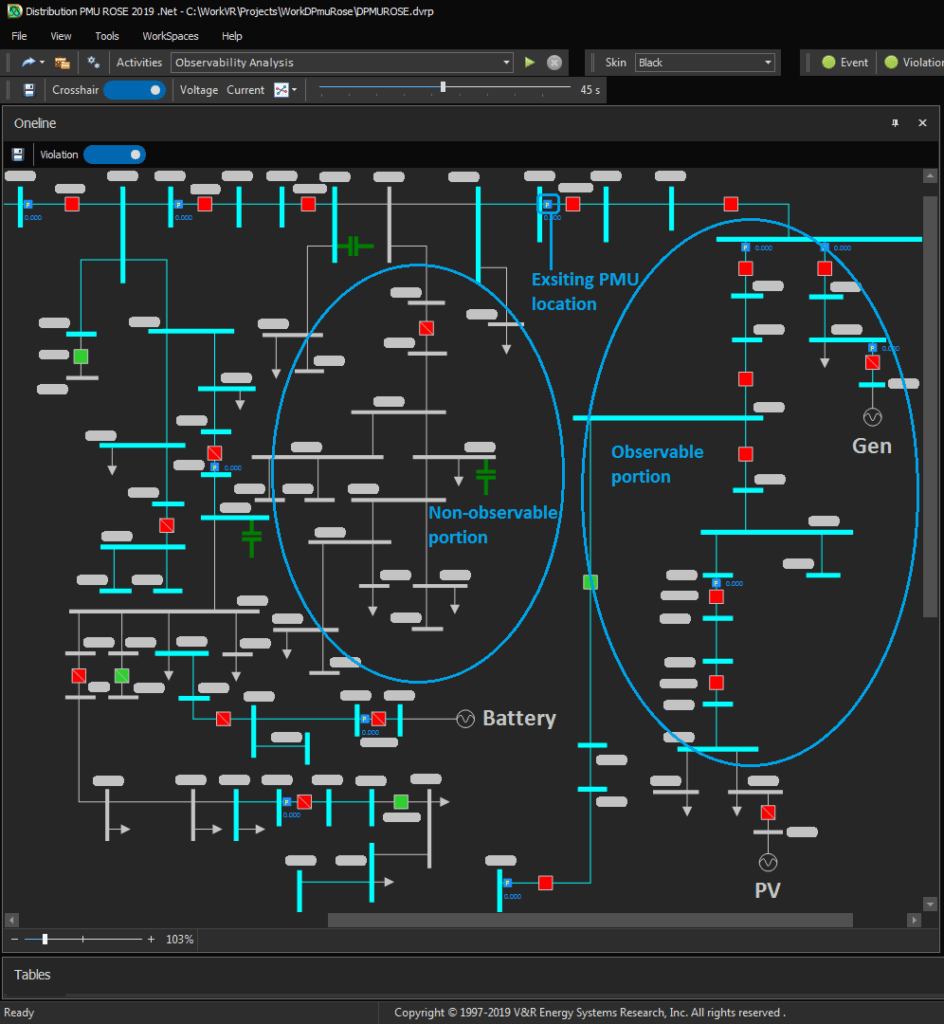
Observability analysis based on the existing PMU locations identifies observable and non-observable portions of the distribution network/microgrid. Observability analysis is performed in real-time, and observability may change when a switching event occurs and network topology changes. Observable and non-observable portions of the network are shown in different colors in the single-line diagram: portions of the distribution network observable with PMUs are shown in blue, non-observable portions in gray.
The purpose of the event detection computation in D-PMU ROSE is to correctly identify switching events (e.g., topology change detection) and microgrid configuration without supplying switch status to the D-LSE platform. D-LSE detected that a microgrid starts to operate in a fully islanded mode.
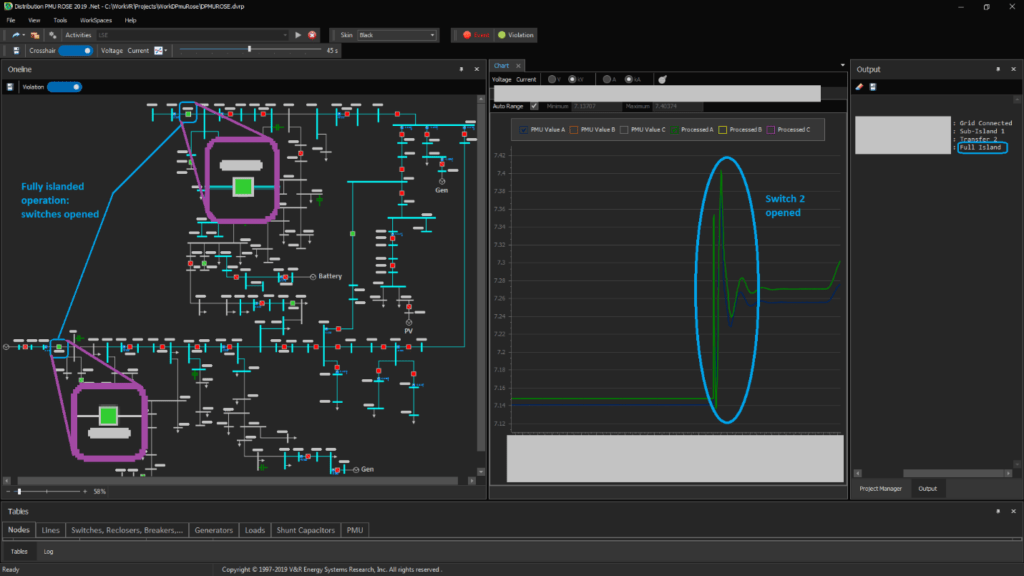
D-PMU ROSE uses machine learning techniques during event detection computations.